This blog post originally appeared in the SAP Community on 12/08/2020.
Discovery Consulting was recently involved in the global SAP SuccessFactors Implementation Design Principles (IDP) workshop on SAP SuccessFactors Integration patterns. Our practice of logging the results of SAP CPI iFlows into SAP SuccessFactors Execution Manager was picked up by the group as a potential SAP recommended best practice! Hopefully, we will see something come out from SAP in the future around this. However, whilst we wait for that to happen – here’s some details about how we at Discovery use this integration best practice to help our clients support their SAP SuccessFactors instances and be better equipped to deal with issues if and when they occur.
This post is targeted at an audience of SAP Cloud Integration developers and the SAP SuccessFactors administrator that they work with. It is a quite technical post and gives some great detail on the solutions that we use with our customers.
Firstly, a little background. Too often in the past I have seen support calls from customers about SAP SuccessFactors to/from SAP ERP (and other systems) integrations and a request to “find out what went wrong.” Many/most of these issues could be solved if only the SAP SuccessFactors administrators had access to any error/success messages that the integrations were producing. The aim of these blogs is to show how easy it is to incorporate logging to SAP SuccessFactors Execution Manager into all your SAP CPI integrations so that admins and developers have a simple way to monitor all SAP SuccessFactors integrations.
This post is the second in a series about this logging – you can read the first post which gives some details about the Execution Manager and using OData APIs to update it here:
SAP CPI and Successfactors Monitoring EP01: The one with the Execution Manager Dashboard
Enough background – on with the show!
From my first post we, hopefully, now have an idea of how easy it is to log information into the Execution Manager Dashboard in SAP SuccessFactors. It is now time to put our knowledge to use. As Dale Carnegie once said,
“Knowledge isn’t power until it’s applied.“,
It’s time for us to finally go ahead and see a bigger picture of how exactly we can harness the Execution Manager to our advantage. In this post, I’ll be focusing on how I implemented the Execution Manager in SAP Cloud Platform Integration iFlow.
Bird’s eye view of the implementation
This implementation consists of an iFlow and a simple reusable groovy script to generate EMEvent payload groovy script. Just to make things a bit modular here, I broke the iFlow into the following integration processes:
- Main integration process,
- Few local integration processes for the following:
2.1 populating demo data(in external parameters and body) to imitate the process of generating data to be posted to Execution Manager Dashboard, and
2.2 sending data to Execution Manager Dashboard using HTTP adapter - a separate local integration process for exception handling, and
- a groovy script to generate EMEvent payload to be sent to Execution Manager Dashboard in SAP SuccessFactors.
Now before I get into the details, I would like to quote an expression by Tess Flanders in 1911 that fits here perfectly,
“Use a picture. It’s worth a thousand words“.
So here, I share with you how exactly the implementation looks like when it is ready to log everything we need in the Execution Manager Dashboard **drumrolls**
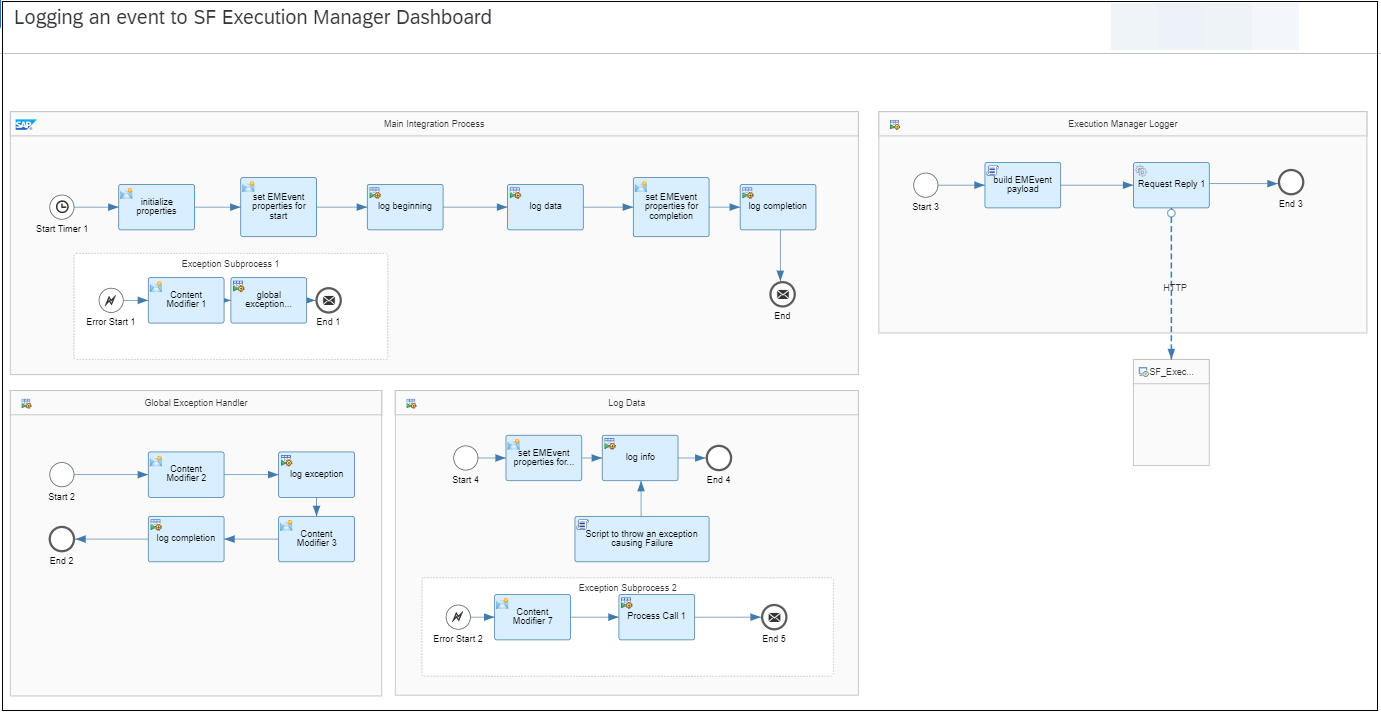
Fig.1: iFlow to log data in Execution Manager Dashboard
Digging into the iFlow
Now let’s see what’s really happening here in the iFlow above (I’ll try explaining things in the order I’ve mentioned above).
1. Main Integration Process
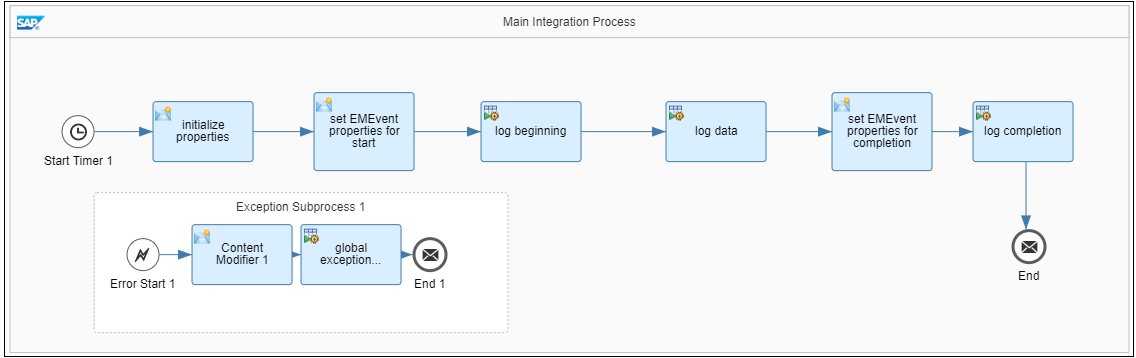
Fig.2: Main integration process
a) In this example, every execution of the main integration process logs 3 separate events into the execution manager dashboard, i.e. START – data/error/warning/failure (you can log as many events representing these between a START and END event) – END :Initializing the external properties for EMEvent payload. Here’s what the ‘initialize properties’ step looks like. I have included a sample payload to log a single event from my previous post and how it maps to the properties initialized.
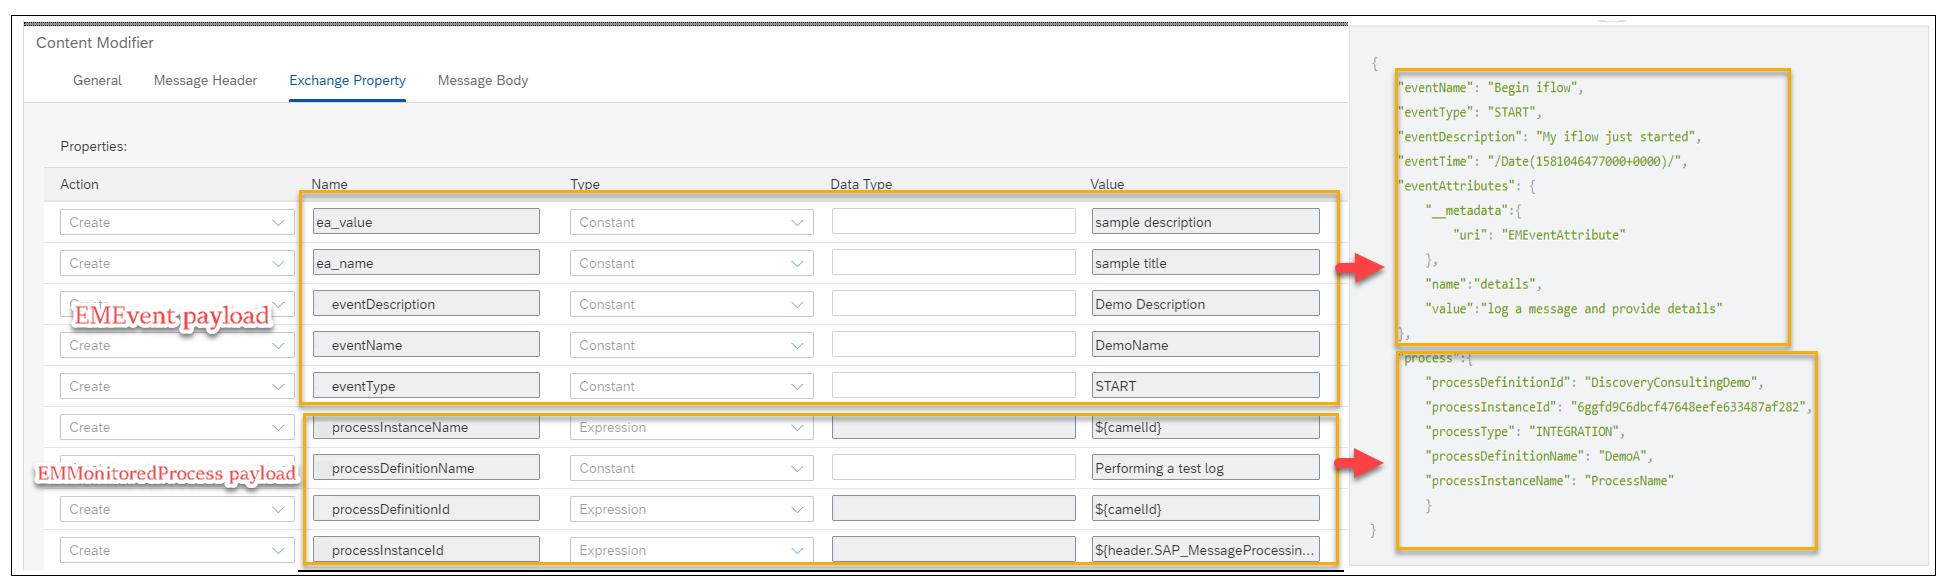
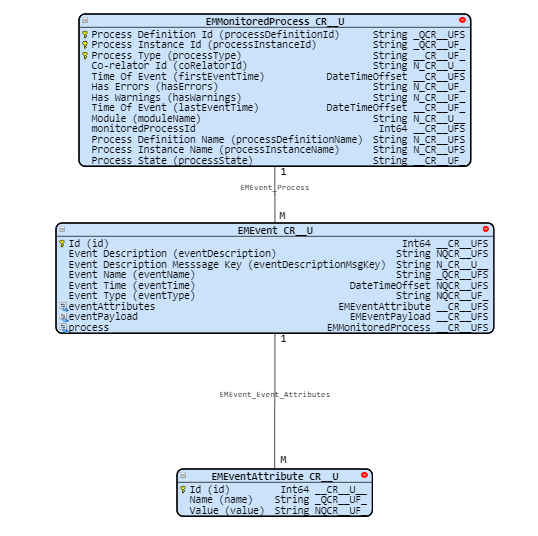
Fig.3: Properties defined for EMEvent and EMMonitoredProcess payload
note: The EMMonitoredProcess payload needs to remain the same, as a single execution of the iFlow represents a process in Execution manager. All the events logged under a single process are clubbed together enclosed within a ‘START’ and an ‘END’ event.
b) Once the properties are initialized, the properties for the EMEvent payload needs to be changed for every event we wish to log. The most important one here is the ‘event_type’ property as it decides the type of event logged into the execution manager. So, the next step here is to change the event_type in a content modifier to ‘START’ as we initially need to log a START event.
c) The next step in line is to log the data that matters in the form of multiple events showing data that is required to be presented in the Execution Manager Dashboard. That is where the ‘log data’ step comes in, which triggers the Log data integration process mentioned in the next section. This integration process can be used to fire multiple events as the iFlow carries on its execution. In this case, the iFlow is designed to log a single event of the type INFO to represent a portion of information.
d) Once, all the data/error/warnings have been logged during the execution, there is another enclosing event that needs to be logged. You guessed it right, END event it is 🙂
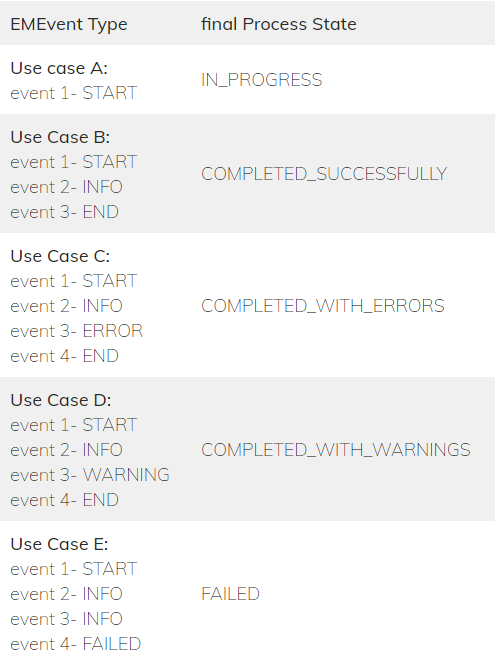
If we fail to log the END event for a process, the process in all would have an ‘IN_PROGRESS’ state rather than the expected ‘COMPLETED’ state (please refer to my previous blog if you need a reference to different scenarios and the final process state for each).
2. Local Integration Processes
2.1 Log Data integration process
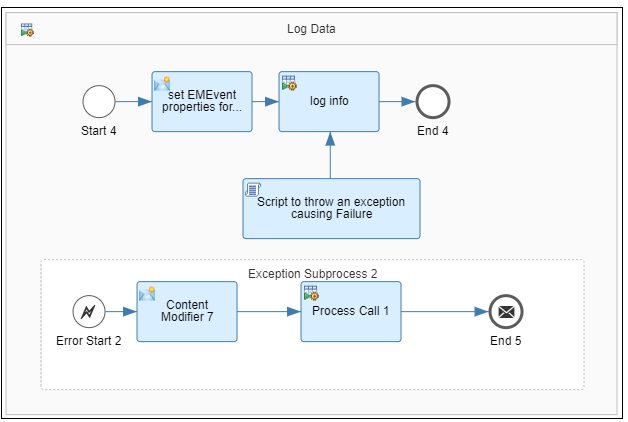
Fig.4: Generating data to log
This local integration flow is to represent a process/set of processes that execute during the lifecycle of an integration flow where the iFlow does what it is actually designed to do (pick data from source A, transform, write into destination B). This could be a single local integration flow, or a set of flows to get your job done. This is where we log the events depending on what data is really required by the business.
2.2 Execution Manager Logger integration process
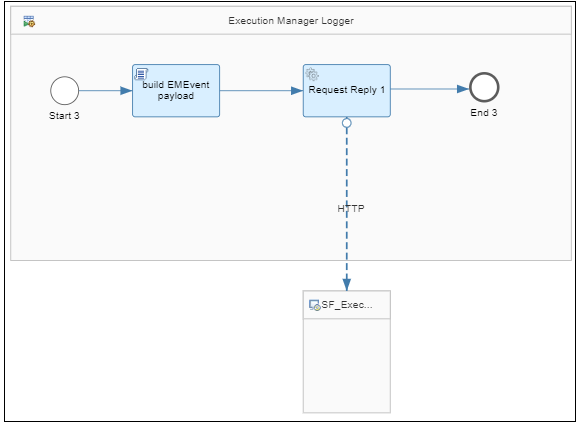
Fig.5: Generating and logging payload to Execution Manager Dashboard
This local integration flow is principally responsible for 2 tasks:
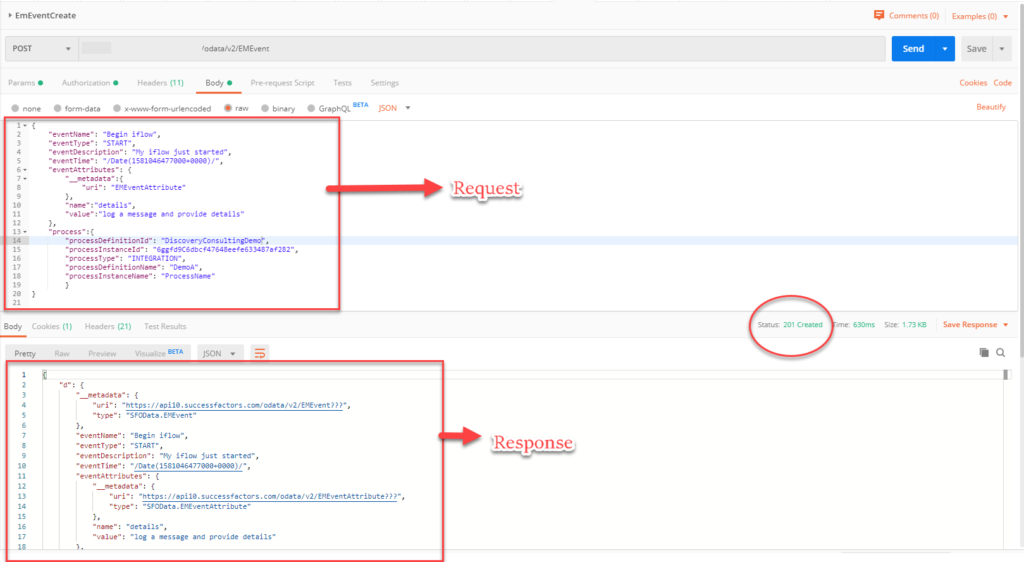
- Executing a script which generates a payload to log an event by using the external properties and body populated by components before this integration process is called.
- Firing a HTTP call to SAP SuccessFactors Execution Manager Dashboard to log the event.
3. Global Exception Handler
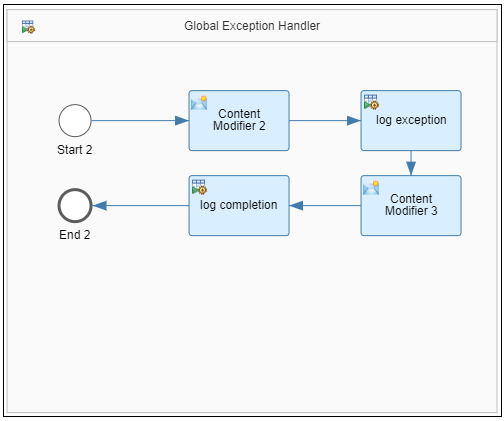
Fig.6: Handling errors and exceptions
While working on the solution, there were times when the iFlow during its execution ran into errors such as errors with the script, HTTP connection issues, etc. that caused the iFlow to fail. But how does that impact our logging and why should we care?
As mentioned before, it is important to log an ‘END’ event for every execution to ensure the EMMonitoredProcess does not end up in a ‘IN_PROGRESS’ state even when the actual execution of the iFlow has stopped/failed.
Therefore, this local integration process is to take care of all the errors/exceptions/failures that occur during the execution and ensuring that proper error messages are logged in to the Execution Manager, followed by an ‘END’ event.
4. EMEvent payload generating groovy script
As simple as it should be, this script picks up data from the external properties and populates them into one single JSON payload consisting of an EMEvent and an EMMonitoringProcess.
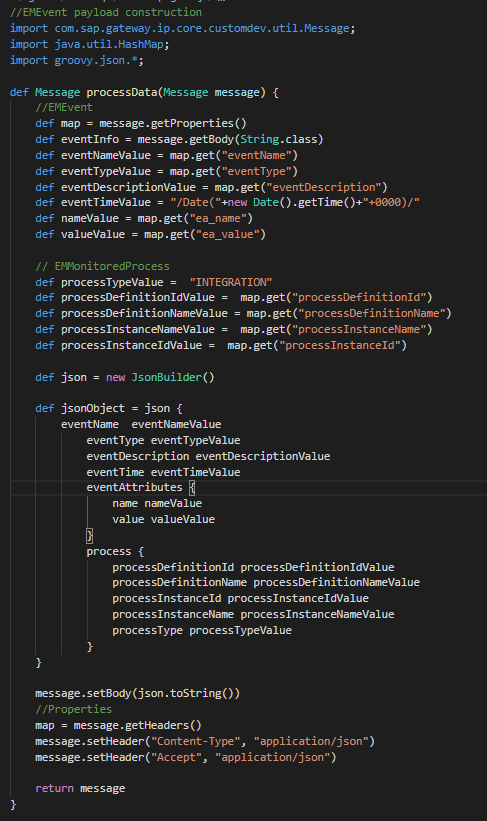
Script 1: Generating EMEvent payload
*disclaimer: Script provided for discussion purposes only, any attempt to use this script or a variation of it in your own integrations is at your own risk. No fitness for use in any particular purpose is, or should be, implied.**
**this said, some of our experienced technical team would be more than happy to help you work with this framework to build out the best solutions for your SAP SuccessFactors instances if you’d like us work with you!
Reaping the results
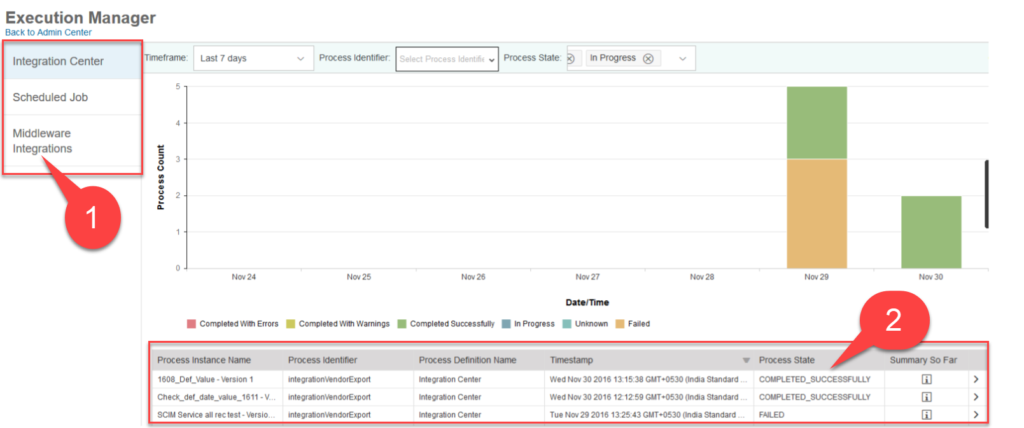
Just for the sake of demonstration, I have considered executing the iFlow 4 times, once for each ‘event_type’ and its impact on the ‘final process state’ of the EMMonitoredProcess/execution as mentioned below.
| Use Case Scenario | final Process State |
| Use Case A: event 1- START event 2- INFO event 3- END | COMPLETED_SUCCESSFULLY |
| Use Case B: event 1- START event 2- ERROR event 3- END | COMPLETED_WITH_ERRORS |
| Use Case C: event 1- START event 2- WARNING event 3- END | COMPLETED_WITH_WARNINGS |
| Use Case D: event 1- START event 2- INFO event 3- FAILED | FAILED |
Table 1: EMEvent use case scenarios and their impact on final process state
And this is how the scenarios look like when executed one after the other:
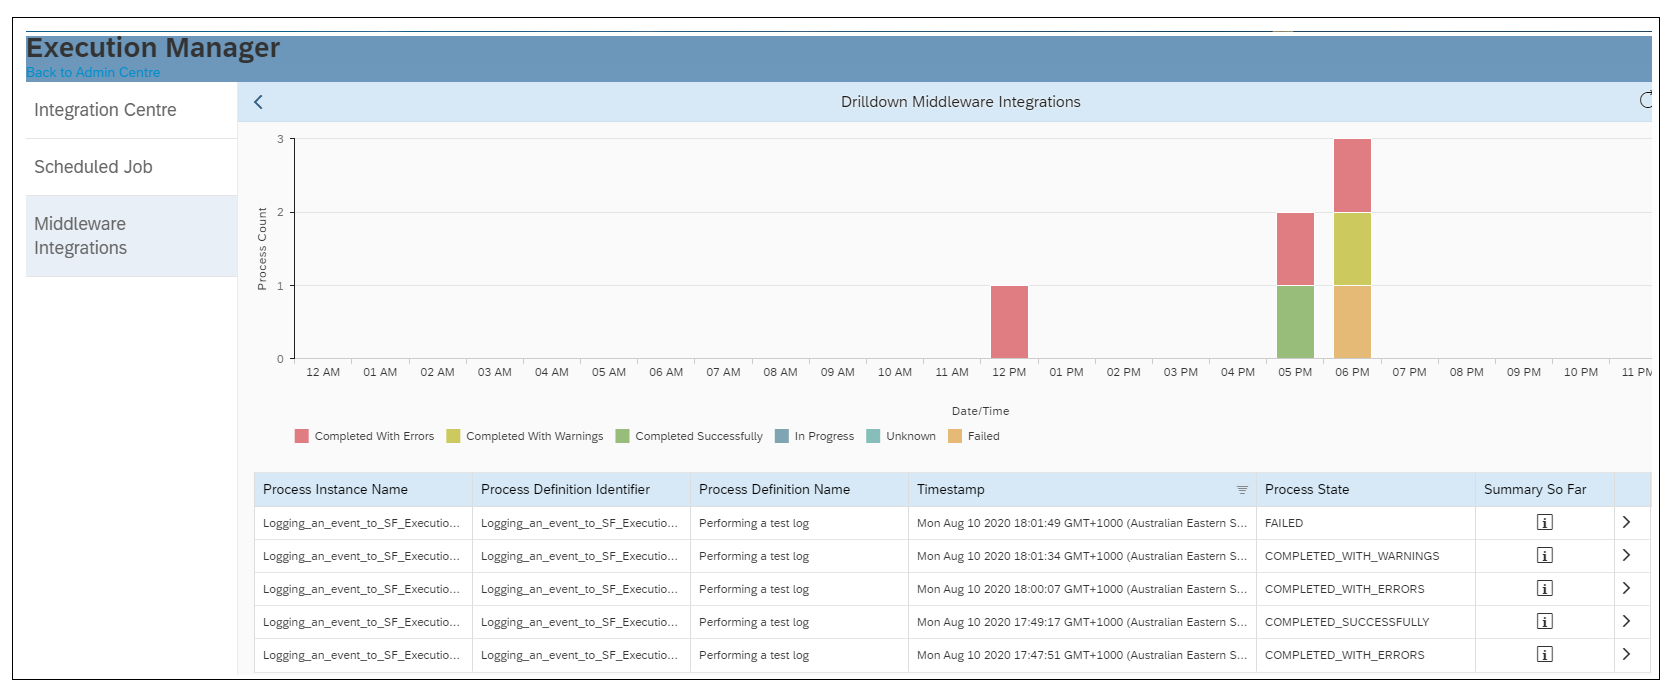
Fig.7: Execution Manager Dashboard after logging the events
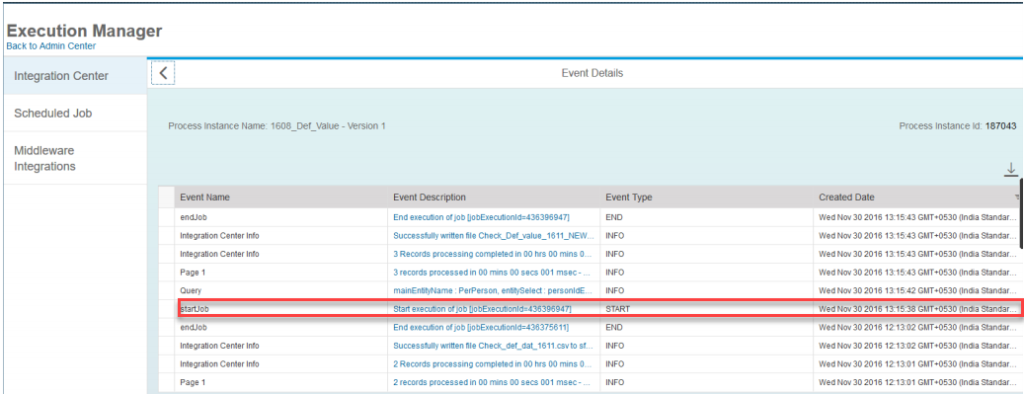
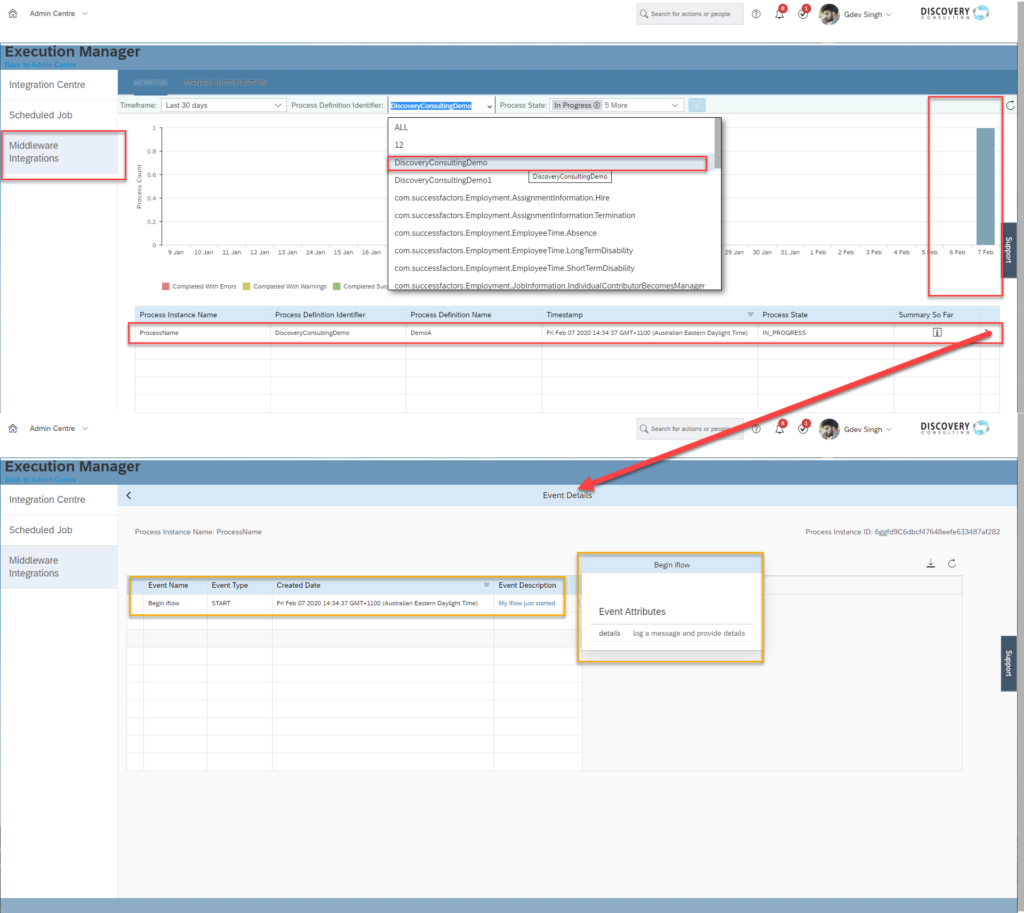
But how do I debug this? How do I trace a Process/execution back to the message in CPI?
If you scroll back up to Fig.3 and look at the EMMonitoredProcess payload, you will notice an attribute called ‘processInstanceId’. Process Instance ID as the name suggests, is to uniquely identify a single execution/process which clubs together several events under it.
But don’t we have something similar in SAP CPI to identify a particular execution of an artifact/iFlow?
As mentioned in the Developer’s Guide (2020), every message that travels across in an iFlow has a few header fields by default which has information about the iFlow/artifact they belong to. One such header field is ‘SAP_MessageProcessingLogID’ which uniquely identifies a particular message/execution of the iFlow and can be found under the Label MessageID in CPI’s ‘Monitor Message Processing’ page.
Let me show you below, how the ‘processInstanceId’ external property that we populated with the field ‘SAP_MessageProcessingLogID’ in CPI can be correlated with Execution Manager Dashboard’s ‘Process Instance ID’.
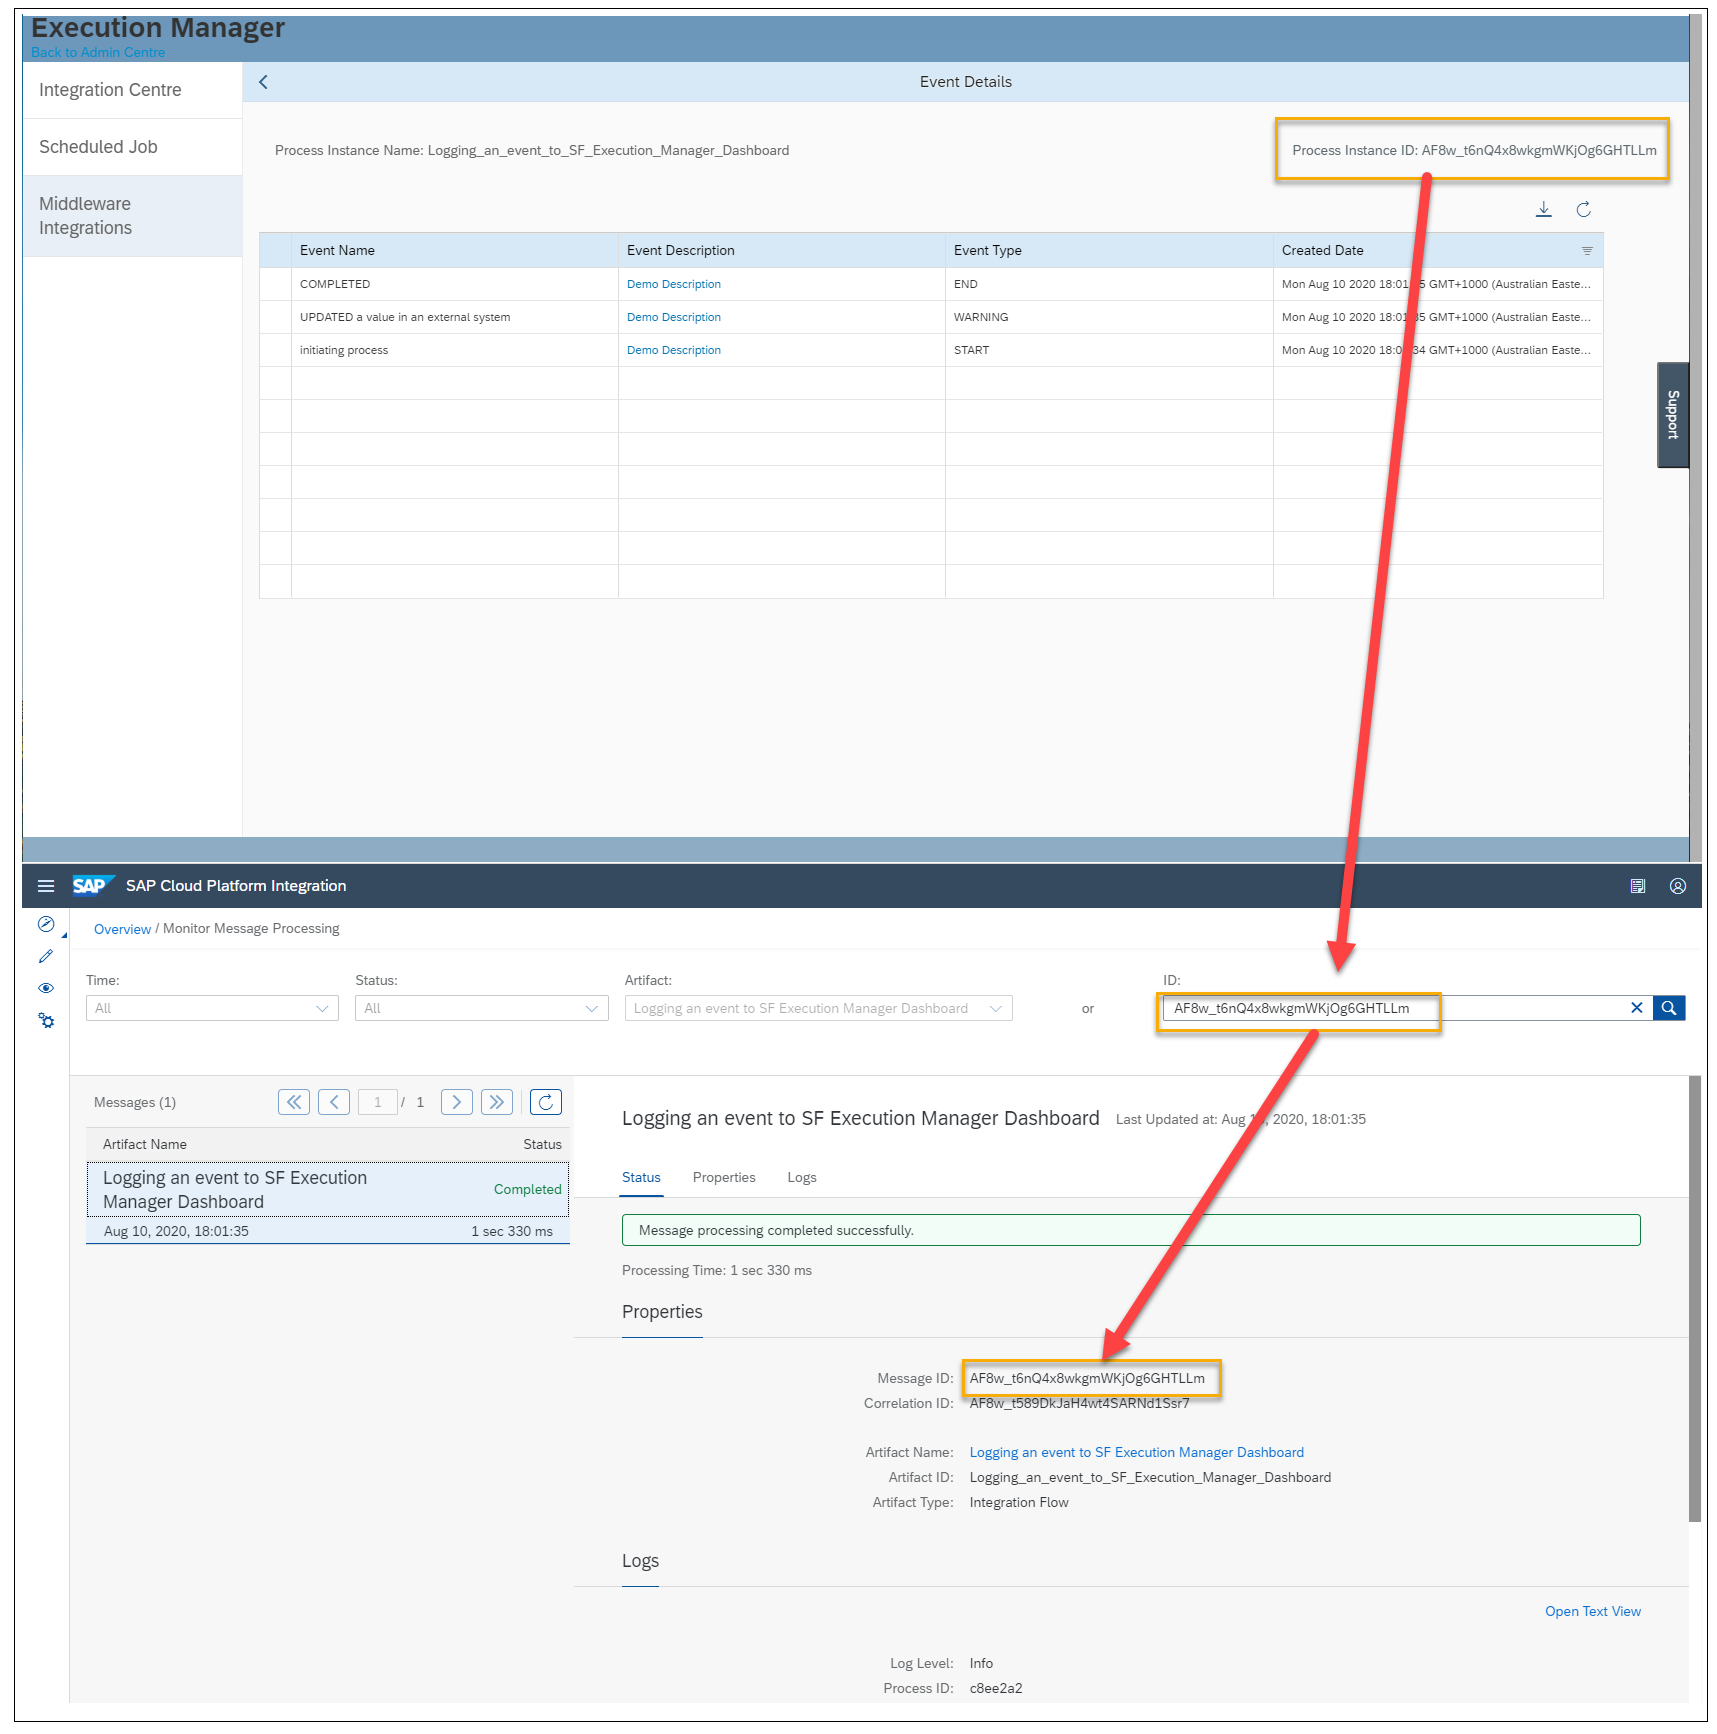
Fig.8: Mapping an EMMonitoredProcess to an execution in SAP CPI
Conclusion
With everything in place, I hope you can see how this is an effective and relatively simple way to standardize the monitoring of integration flows in SAP CPI for an SAP SuccessFactors admin. It does this in a way that collates all the integrations associated with your SAP SuccessFactors instance in a single place to enable the developers and admins to monitor everything from a single dashboard.
This not only helps the developers but the business users who need to check the overall performance of the Integrations without having to access SAP CPI and learn how to navigate that platform as well as SAP SuccessFactors.
That’s all Folks!
I hope that you enjoyed these posts. I’d like to thank my colleagues and their collective efforts for helping me pull these together. It’s great to work with a team that continues to innovate, extend and make SuccessFactors integration as easy to use as possible for all our customers.
Thanks for your time!
References
Developer’s Guide, 2020. Developer’s Guide: Managing Integration Content. [Online]
Available at: help.sap.com
[Accessed 11-08-2020].